Driving Sales Growth

CONNECTED IDEAS PLATFORM


Overview
Overview
Overview
A unified data platform for Sales Team to support transition of customers from Ala Carte to Enterprise Agreement Model.
A unified data platform for Sales Team to support transition of customers from Ala Carte to Enterprise Agreement Model.
AUDIENCE
AUDIENCE
Sales Team @ Cisco
Sales Team @ Cisco
TEAM
TEAM
2 Data Analysts, 1 Product Leader and Developer, Data Engineer and UX Lead(me).
2 Data Analysts, 1 Product Leader and Developer, Data Engineer and UX Lead(me).
DURATION
DURATION
8 Weeks
8 Weeks
TOOLS
TOOLS
Figma, Miro, Excel
Figma, Miro, Excel
Context
Context
Context
Global Sellers at Cisco sell services to customers, partners, and distributors. Traditionally, these services were offered individually through an À La Carte model, where each service was purchased separately. However, the business began transitioning to an Enterprise Agreement model, bundling multiple services under a single contract. This shift established long-term commitments between Cisco and its clients, ensuring continued service delivery over a specified period.
Global Sellers at Cisco sell services to customers, partners, and distributors. Traditionally, these services were offered individually through an À La Carte model, where each service was purchased separately. However, the business began transitioning to an Enterprise Agreement model, bundling multiple services under a single contract. This shift established long-term commitments between Cisco and its clients, ensuring continued service delivery over a specified period.

Business Goals
Business Goals
Business Goals
Why did the business want to transition customers from the À La Carte model to the Enterprise Agreement model? What were the key motivations behind this shift?
Why did the business want to transition customers from the À La Carte model to the Enterprise Agreement model? What were the key motivations behind this shift?
Boost Sales
Boost Sales
The À La Carte model generated transactional revenue, making financial forecasting and long-term planning challenging. The EA model ensured predictable, recurring revenue through long-term contracts, providing financial stability and reducing revenue fluctuations.
The À La Carte model generated transactional revenue, making financial forecasting and long-term planning challenging. The EA model ensured predictable, recurring revenue through long-term contracts, providing financial stability and reducing revenue fluctuations.

Improve Efficiency
Improve Efficiency
Managing individual service sales required extensive negotiations, pricing adjustments, and administrative efforts. The EA model streamlined the sales process by reducing the need for frequent transactions and contract renegotiations, allowing sales teams to focus on strategic growth.
Managing individual service sales required extensive negotiations, pricing adjustments, and administrative efforts. The EA model streamlined the sales process by reducing the need for frequent transactions and contract renegotiations, allowing sales teams to focus on strategic growth.
User Pain Points
User Pain Points
User Pain Points
Why is it challenging for Sellers to implement these business goals? What support do they need?
Zero Insights
Insights Unavailable
Implementing the Enterprise Agreement model for customers posed a significant challenge because sellers didn’t have direct access to key supporting insights. Critical data such as Total Lifetime Value, the number of high-severity TAC cases, and overall customer eligibility were not readily available to them.
3-5 Days
Time to Retrieve Insights
Long wait times to retrieve insights
The current process of gathering data and insights requires 3-5 business days for the analytics team to fulfill information requests, significantly delaying the sales team's ability to make informed decisions.
3-5 Days
Time to Retrieve Insights
Long wait times to retrieve insights
The current process of gathering data and insights requires 3-5 business days for the analytics team to fulfill information requests, significantly delaying the sales team's ability to make informed decisions.
3-5 Days
Time to Retrieve Insights
Long wait times to retrieve insights
The current process of gathering data and insights requires 3-5 business days for the analytics team to fulfill information requests, significantly delaying the sales team's ability to make informed decisions.
3-5 Days
Time to Retrieve Insights
Long wait times to retrieve insights
The current process of gathering data and insights requires 3-5 business days for the analytics team to fulfill information requests, significantly delaying the sales team's ability to make informed decisions.
More Renewals
High Renewal Volume Increases Workload
In the À La Carte model, frequent renewals require sellers to repeatedly engage customers, renegotiate contracts, and process transactions. This increases administrative overhead, reducing the time available for strategic sales efforts and new business opportunities.
Problem Statement
Problem Statement
Problem Statement
Problem Statement
Cisco Sellers spend 3-5 days to get access to actionable insights due to data silos and missing metrics.
Cisco Sellers spend 3-5 days to get access to actionable insights due to data silos and missing metrics.
Understanding Data + Context
Understanding Data + Context
Understanding Data + Context
This Excel sheet provides a quick snapshot of analyzed and calculated data from data analysts.
This Excel sheet provides a quick snapshot of analyzed and calculated data from data analysts.
I worked closely with data analysts to develop a clear understanding of over 50 key metrics, their relationships, and their relevance within the sales ecosystem. This involved familiarizing myself with business terminology and sales jargon to ensure effective collaboration with stakeholders. The team provided explanations as needed, which helped me better engage in discussions, align with stakeholder expectations, and design solutions that effectively addressed user and business needs.
I worked closely with data analysts to develop a clear understanding of over 50 key metrics, their relationships, and their relevance within the sales ecosystem. This involved familiarizing myself with business terminology and sales jargon to ensure effective collaboration with stakeholders. The team provided explanations as needed, which helped me better engage in discussions, align with stakeholder expectations, and design solutions that effectively addressed user and business needs.
It contains key insights that are crucial for sellers, helping them make informed decisions and effectively support the business goal of converting customers from the À La Carte model to the Enterprise Agreement model.
It contains key insights that are crucial for sellers, helping them make informed decisions and effectively support the business goal of converting customers from the À La Carte model to the Enterprise Agreement model.
Mapping information Architecture
Mapping information Architecture
What would be the best way to group these metrics that makes sense to sellers?
What would be the best way to group these metrics that makes sense to sellers?
Identifying Key Data Categories
Identifying Key Data Categories
Grouped metrics based on their purpose, such as customer value, support history, renewal patterns, and eligibility criteria for the EA model.
Grouped metrics based on their purpose, such as customer value, support history, renewal patterns, and eligibility criteria for the EA model.
Organizing Data Based on Seller Priorities
Organizing Data Based on Seller Priorities
Prioritized high-impact insights that sellers needed at a glance (e.g., Total Lifetime Value, Renewal Trends, High-Severity TAC Cases).
Created a tiered information structure:
Primary Information: Critical metrics required for quick decision-making.
Secondary Information: Supporting insights that help sellers refine their strategy.
ertiary Information: Additional data that provides deeper context if needed.
Building on the principles of information architecture and insights from stakeholder interviews, where I gained a deeper understanding of user needs, I mapped the information into two key categories: "What sellers want to know" and "Why they need to know it." This approach helped structure the data based on relevance and intent. From there, I categorized the information into distinct buckets, including Enterprise Agreement, Service Mix, TAC Data, and ROI (which was later refined and renamed as Total Cost of Ownership (TCO)).
Building on the principles of information architecture and insights from stakeholder interviews, where I gained a deeper understanding of user needs, I mapped the information into two key categories: "What sellers want to know" and "Why they need to know it." This approach helped structure the data based on relevance and intent. From there, I categorized the information into distinct buckets, including Enterprise Agreement, Service Mix, TAC Data, and ROI (which was later refined and renamed as Total Cost of Ownership (TCO)).

After mapping the information and collaborating with data analysts, I quickly put together the Information Architecture and user flow to structure insights in a way that made sense for sellers. This helped lay the groundwork for quick design concepts, making it easier to get early buy-in from external stakeholders, especially leaders in the Global Sales Team. The goal was to ensure the design direction aligned with both user needs and business objectives while setting the stage for more refined iterations.
After mapping the information and collaborating with data analysts, I quickly put together the Information Architecture and user flow to structure insights in a way that made sense for sellers. This helped lay the groundwork for quick design concepts, making it easier to get early buy-in from external stakeholders, especially leaders in the Global Sales Team. The goal was to ensure the design direction aligned with both user needs and business objectives while setting the stage for more refined iterations.


Mockups
Mockups
Communicating early design concepts to stakeholders was crucial for securing buy-in and gathering relevant feedback.
Communicating early design concepts to stakeholders was crucial for securing buy-in and gathering relevant feedback.
The challenge, however, was the tight timeline, which meant there wasn’t room to explore multiple variations or possibilities. Instead, the focus was on clearly presenting the flow, the data, and how it was prioritized—ensuring stakeholders understood the structure and logic behind the design decisions. Layout and UI patterns took a backseat, as the priority was aligning on the overall information hierarchy and user journey before refining the visual details.
The challenge, however, was the tight timeline, which meant there wasn’t room to explore multiple variations or possibilities. Instead, the focus was on clearly presenting the flow, the data, and how it was prioritized—ensuring stakeholders understood the structure and logic behind the design decisions. Layout and UI patterns took a backseat, as the priority was aligning on the overall information hierarchy and user journey before refining the visual details.
Detailed Enterprise Agreement Overview with Segmented Views to Support Sellers' Workflow
Detailed Enterprise Agreement Overview with Segmented Views to Support Sellers' Workflow


WHY
Based on feedback from stakeholders and SMEs, it was recommended to include not just a customer view but also a partner and distributor view. This enhancement allows users to go beyond viewing individual customer information and supports sellers who need to identify and manage customers within specific partners or distributors.
HOW
To accommodate this flow, I added a segmented button with options for customer, partner, and distributor. This allows sellers to select the most relevant option based on their workflow, creating a more organized view and improving the ability to search for and access information efficiently.
HOW
To accommodate this flow, I added a segmented button with options for customer, partner, and distributor. This allows sellers to select the most relevant option based on their workflow, creating a more organized view and improving the ability to search for and access information efficiently.
WHY
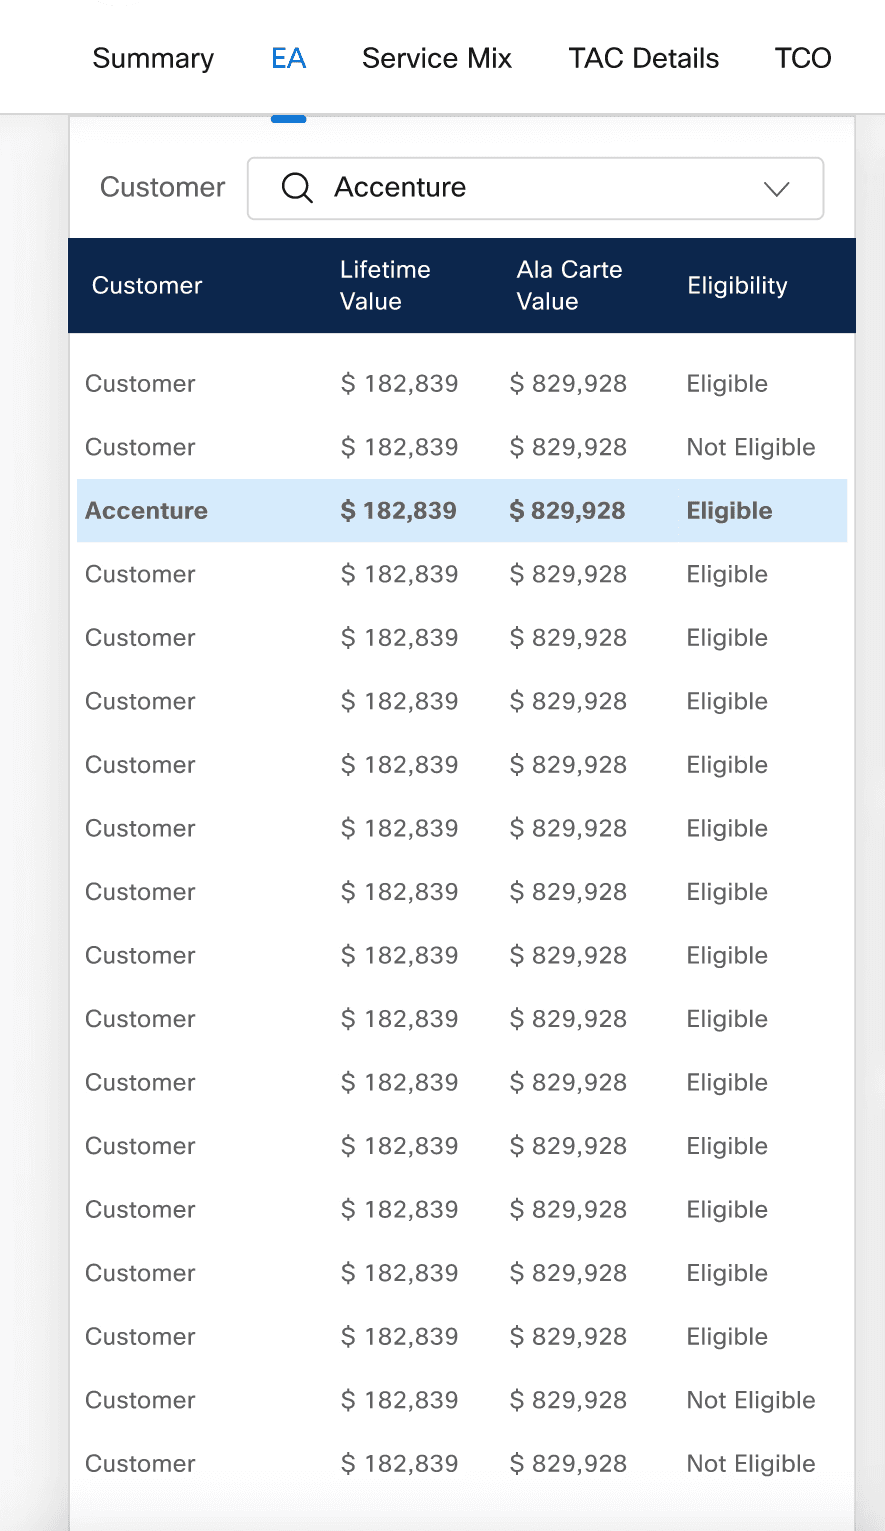
Through concept testing with end users, we discovered an additional use case where users wanted the ability to select a customer based on key insights about them rather than relying solely on search or predefined lists.
WHY
Through concept testing with end users, we discovered an additional use case where users wanted the ability to select a customer based on key insights about them rather than relying solely on search or predefined lists.
HOW
The table of customers on the left side of the view allows users to select a customer and quickly access key insights about them such as total lifetime value, à la carte value, and eligibility, indicating whether they qualify for an enterprise agreement. This feature provides users with relevant data at a glance, helping them make informed decisions efficiently.
TAC Details View: Analyzing Case Insights and Severity Levels
TAC Details View: Analyzing Case Insights and Severity Levels
This page provides an overview of TAC (Technical Assistance Center) details, showcasing key metrics such as case counts, severity levels, and resolution times.
The right panel present visualizations, including a trend line for case counts over fiscal years, a breakdown of case severity levels, and other metrics like average resolution time and frequency of case openings. Additional insights, such as the top business entities associated with cases and resolution codes, are also displayed for further analysis.
This view equips users with actionable insights to assess customer support patterns and prioritize efforts, aligning with business goals of improving service quality and customer satisfaction.


WHY
This insight from stakeholder meetings highlights the sellers need for specific time-based case data, focusing on the last three and two years. This requirement likely stems from their need to analyze recent trends,
WHY
This insight from stakeholder meetings highlights the sellers need for specific time-based case data, focusing on the last three and two years. This requirement likely stems from their need to analyze recent trends,
HOW
To address this requirement, two text cards were added to display the total case counts for the last three and two years, offering a quick snapshot of key figures. Additionally, a line graph was incorporated to illustrate the distribution of cases over the past three years, providing a clear trend analysis and supporting users with precise data when needed, thereby enabling progressive information disclosure.

WHY
One of the key use cases identified was that sellers want to determine which Business Entities (BEs) and resolution codes contribute to a higher number of cases. This insight allows them to quickly identify these BEs and their associated services, enabling more targeted analysis and decision-making.
HOW
The progressive information structure ensures that key insights are immediately visible while allowing users to dive deeper into granular details as needed. By organizing the data this way, stakeholders can efficiently scan high-level trends before exploring specific business entities and their case counts in the grouped tables.
Service Mix Insights: Current and Potential Renewals Across Quarters/Years
Service Mix Insights: Current and Potential Renewals Across Quarters/Years
Iteration 1:
The initial idea was to show the overall distribution of service types purchased by customers, providers, and distributors. However, during a stakeholder review, they mentioned they’d like to see this distribution presented differently. I also heard feedback like, "We’re not sure, but this visual representation isn’t quite working for us," which made it clear that a different approach was needed.

Iteration 2:
To address the challenge, several approaches were explored to communicate information effectively using vertical bar charts and stacked visuals. Despite these efforts, feedback remained consistent. To dig deeper, a quick workshop was conducted with data analysts to identify the root cause.
It was revealed that the data being communicated did not align with the sellers' goals, indicating a shift in intent. As a result, it was determined that focusing on communicating Renewals while presenting a future state projection showing the impact if customers opted for an EA (Enterprise Agreement) would better meet the sellers' needs and drive actionable insights.


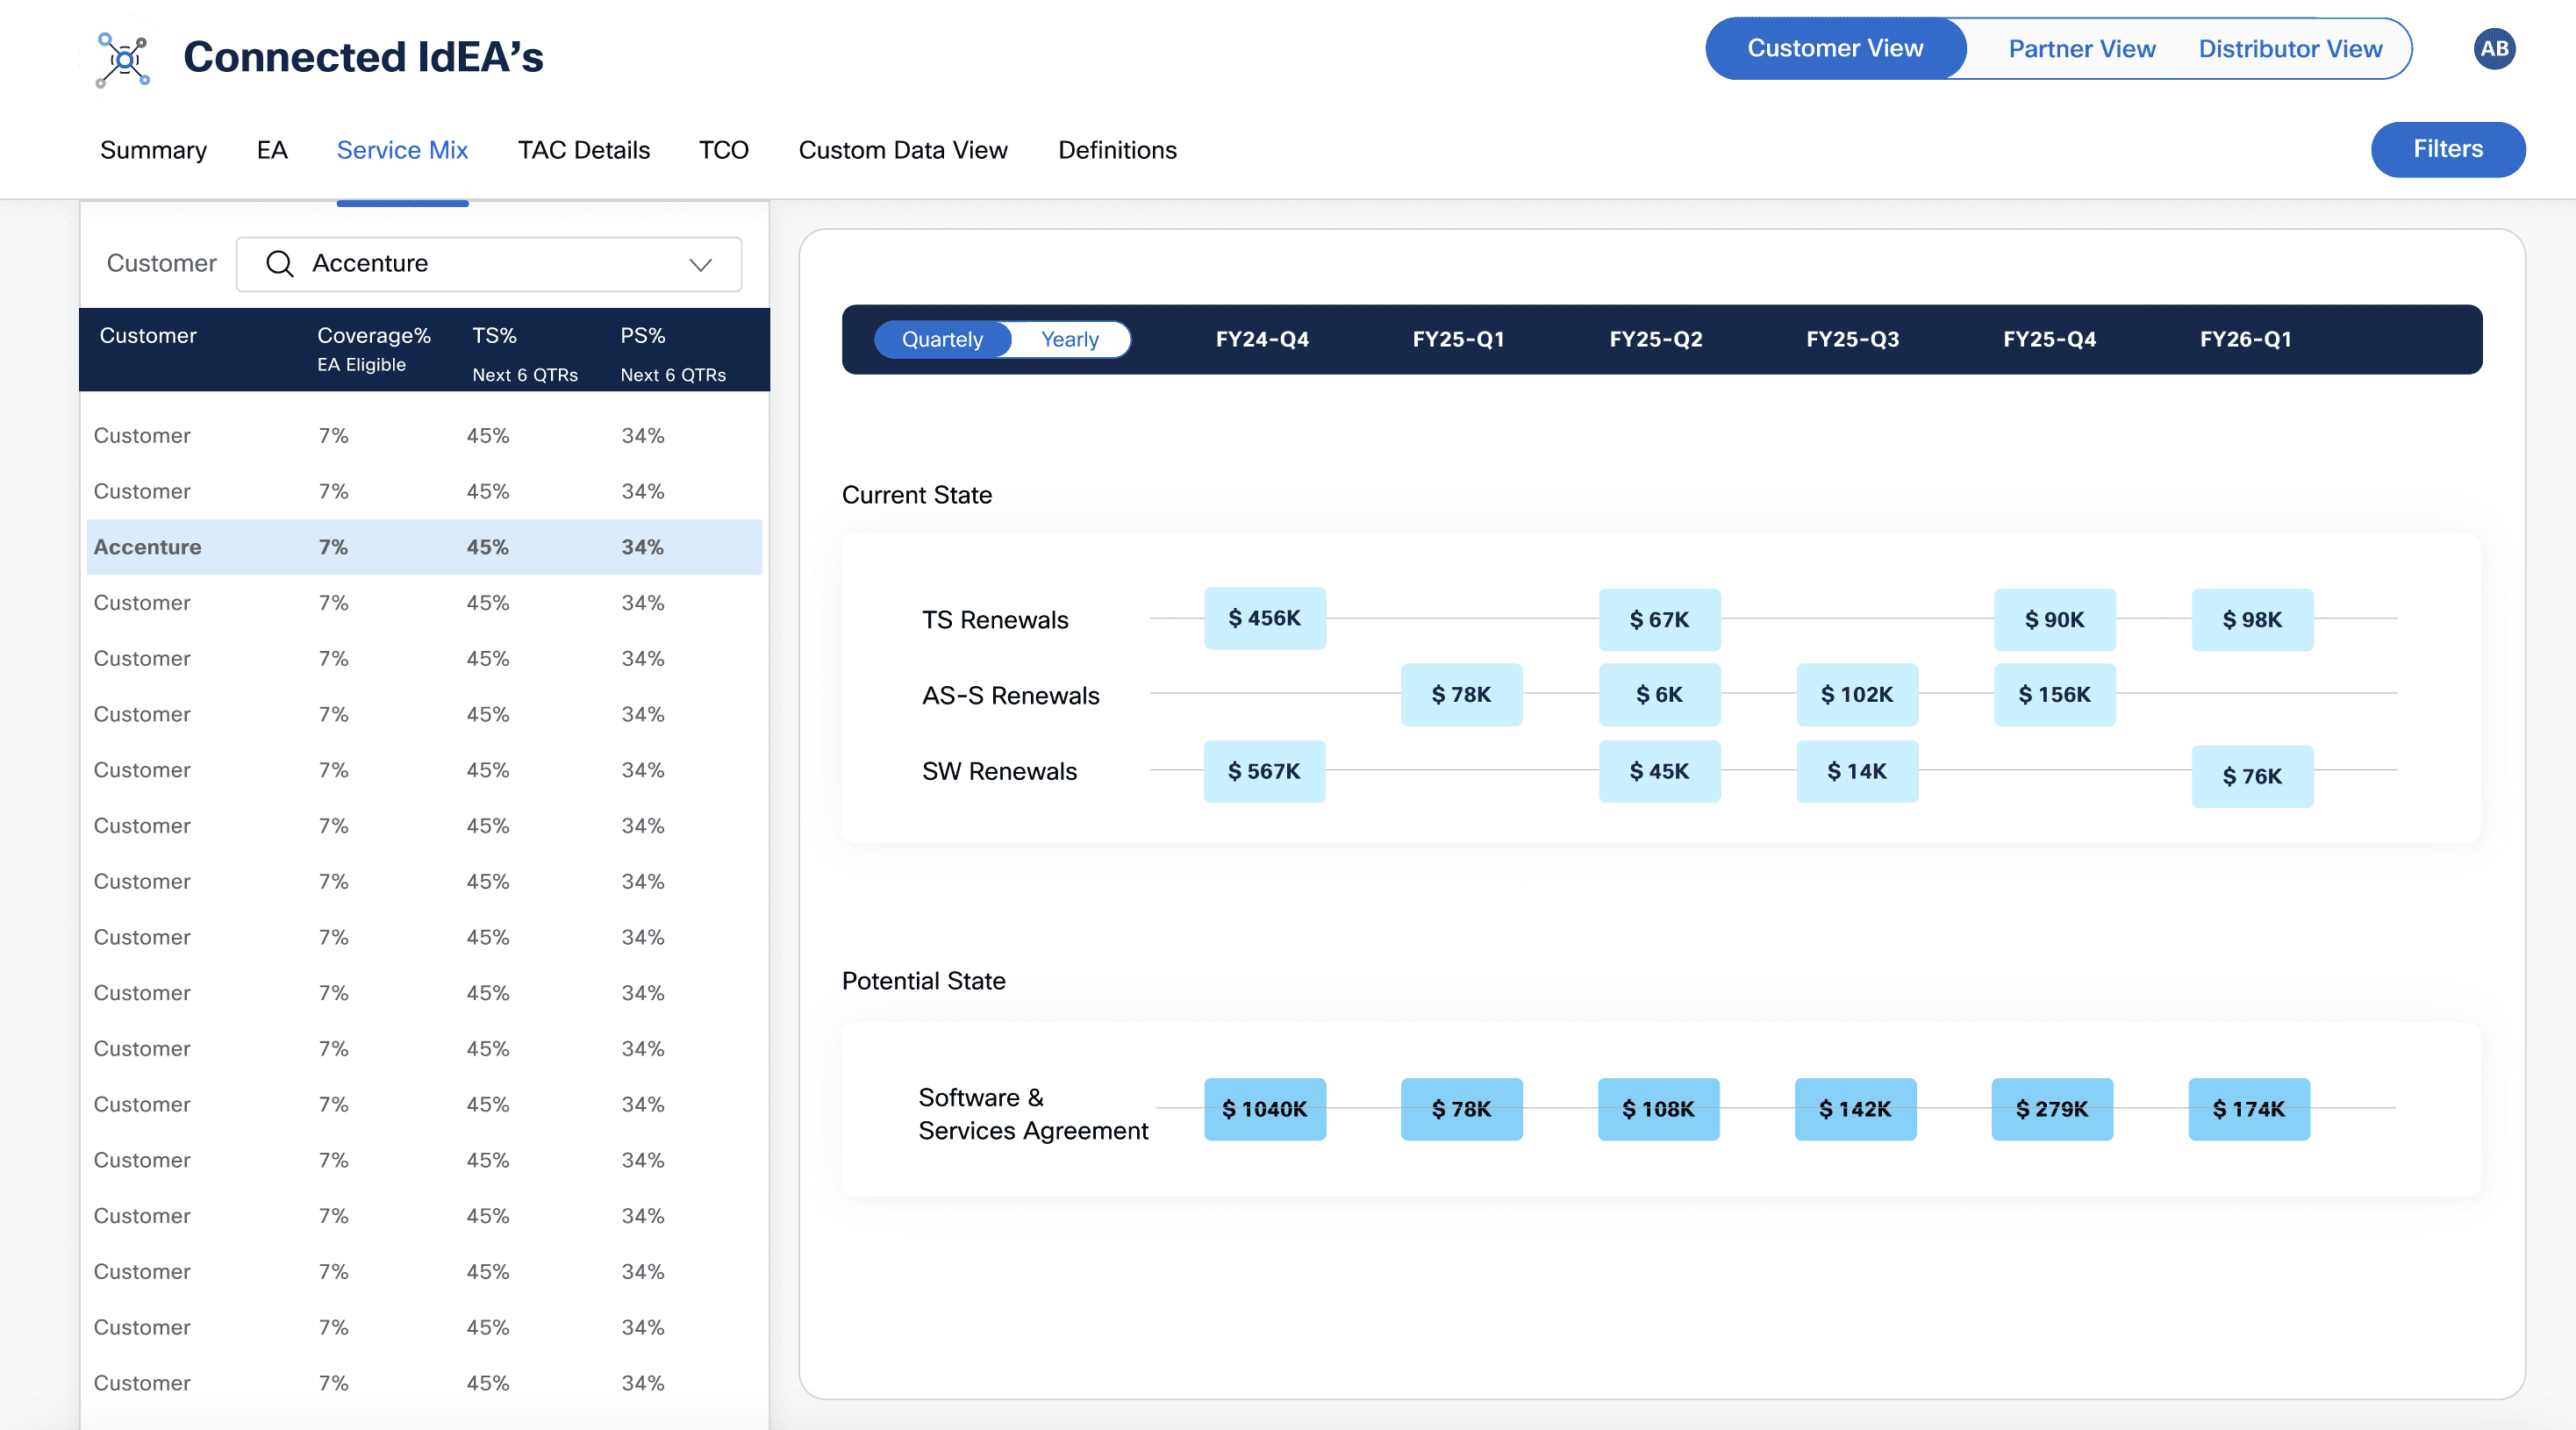
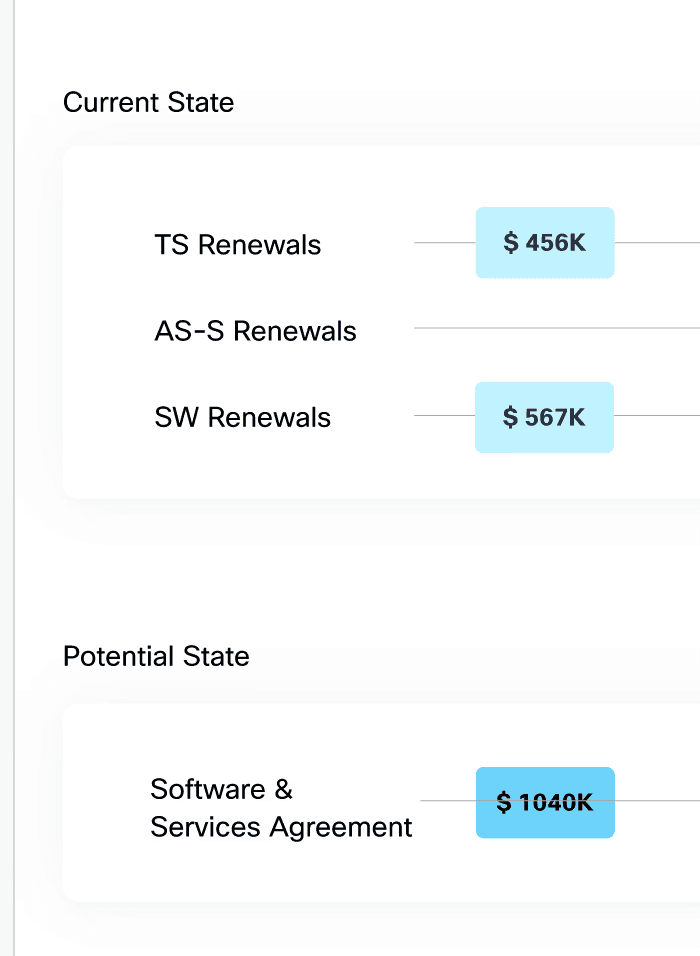
Iteration 3: This page presents customer-specific service mix insights, highlighting key metrics such as coverage percentage, TS (Technical Support) renewals, and AS-S (Advanced Services - Support) renewals. It provides a comparative view of the current state and potential state, enabling stakeholders to evaluate existing renewals alongside potential future opportunities.
Iteration 3: This page presents customer-specific service mix insights, highlighting key metrics such as coverage percentage, TS (Technical Support) renewals, and AS-S (Advanced Services - Support) renewals. It provides a comparative view of the current state and potential state, enabling stakeholders to evaluate existing renewals alongside potential future opportunities.

WHY
Based on the feedback received from external stakeholders including SMEs, it became clear that designing an experience allowing sellers to compare the current and future states of renewals within a single view was essential.
WHY
Based on the feedback received from external stakeholders including SMEs, it became clear that designing an experience allowing sellers to compare the current and future states of renewals within a single view was essential.
HOW
Instead of using e-charts or other data visualizations, a visual approach was implemented using text cards and containers to communicate the information effectively. This design enhances the ease of looking up information compared to traditional tabular formats while also improving readability and quick comprehension. Additionally, it provides a structured layout that organizes key insights in a more digestible format.

WHY
Based on stakeholder requirements, it was crucial to communicate renewals across two timeframes: Yearly and Quarterly.
WHY
Based on stakeholder requirements, it was crucial to communicate renewals across two timeframes: Yearly and Quarterly.
HOW
To address this, a segmented button was introduced alongside the timelines, providing options for Yearly and Quarterly views, with Quarterly set as the default.
HOW
To address this, a segmented button was introduced alongside the timelines, providing options for Yearly and Quarterly views, with Quarterly set as the default.
Total Opportunity and Total Cost of Ownership(TCO) Analysis
Total Opportunity and Total Cost of Ownership(TCO) Analysis
This page provides a comprehensive view of the Total Opportunity and Potential TCO (Total Cost of Ownership) for selected customers. It highlights eligibility status, total opportunity value, and a detailed breakdown of opportunities across service categories such as Application Infrastructure, Security, and Network Infrastructure. Additionally, it includes a visual representation of Potential TCO over time, showcasing ROI projections and key milestones, with options to compare 3-year and 5-year plans.
This page provides a comprehensive view of the Total Opportunity and Potential TCO (Total Cost of Ownership) for selected customers. It highlights eligibility status, total opportunity value, and a detailed breakdown of opportunities across service categories such as Application Infrastructure, Security, and Network Infrastructure. Additionally, it includes a visual representation of Potential TCO over time, showcasing ROI projections and key milestones, with options to compare 3-year and 5-year plans.

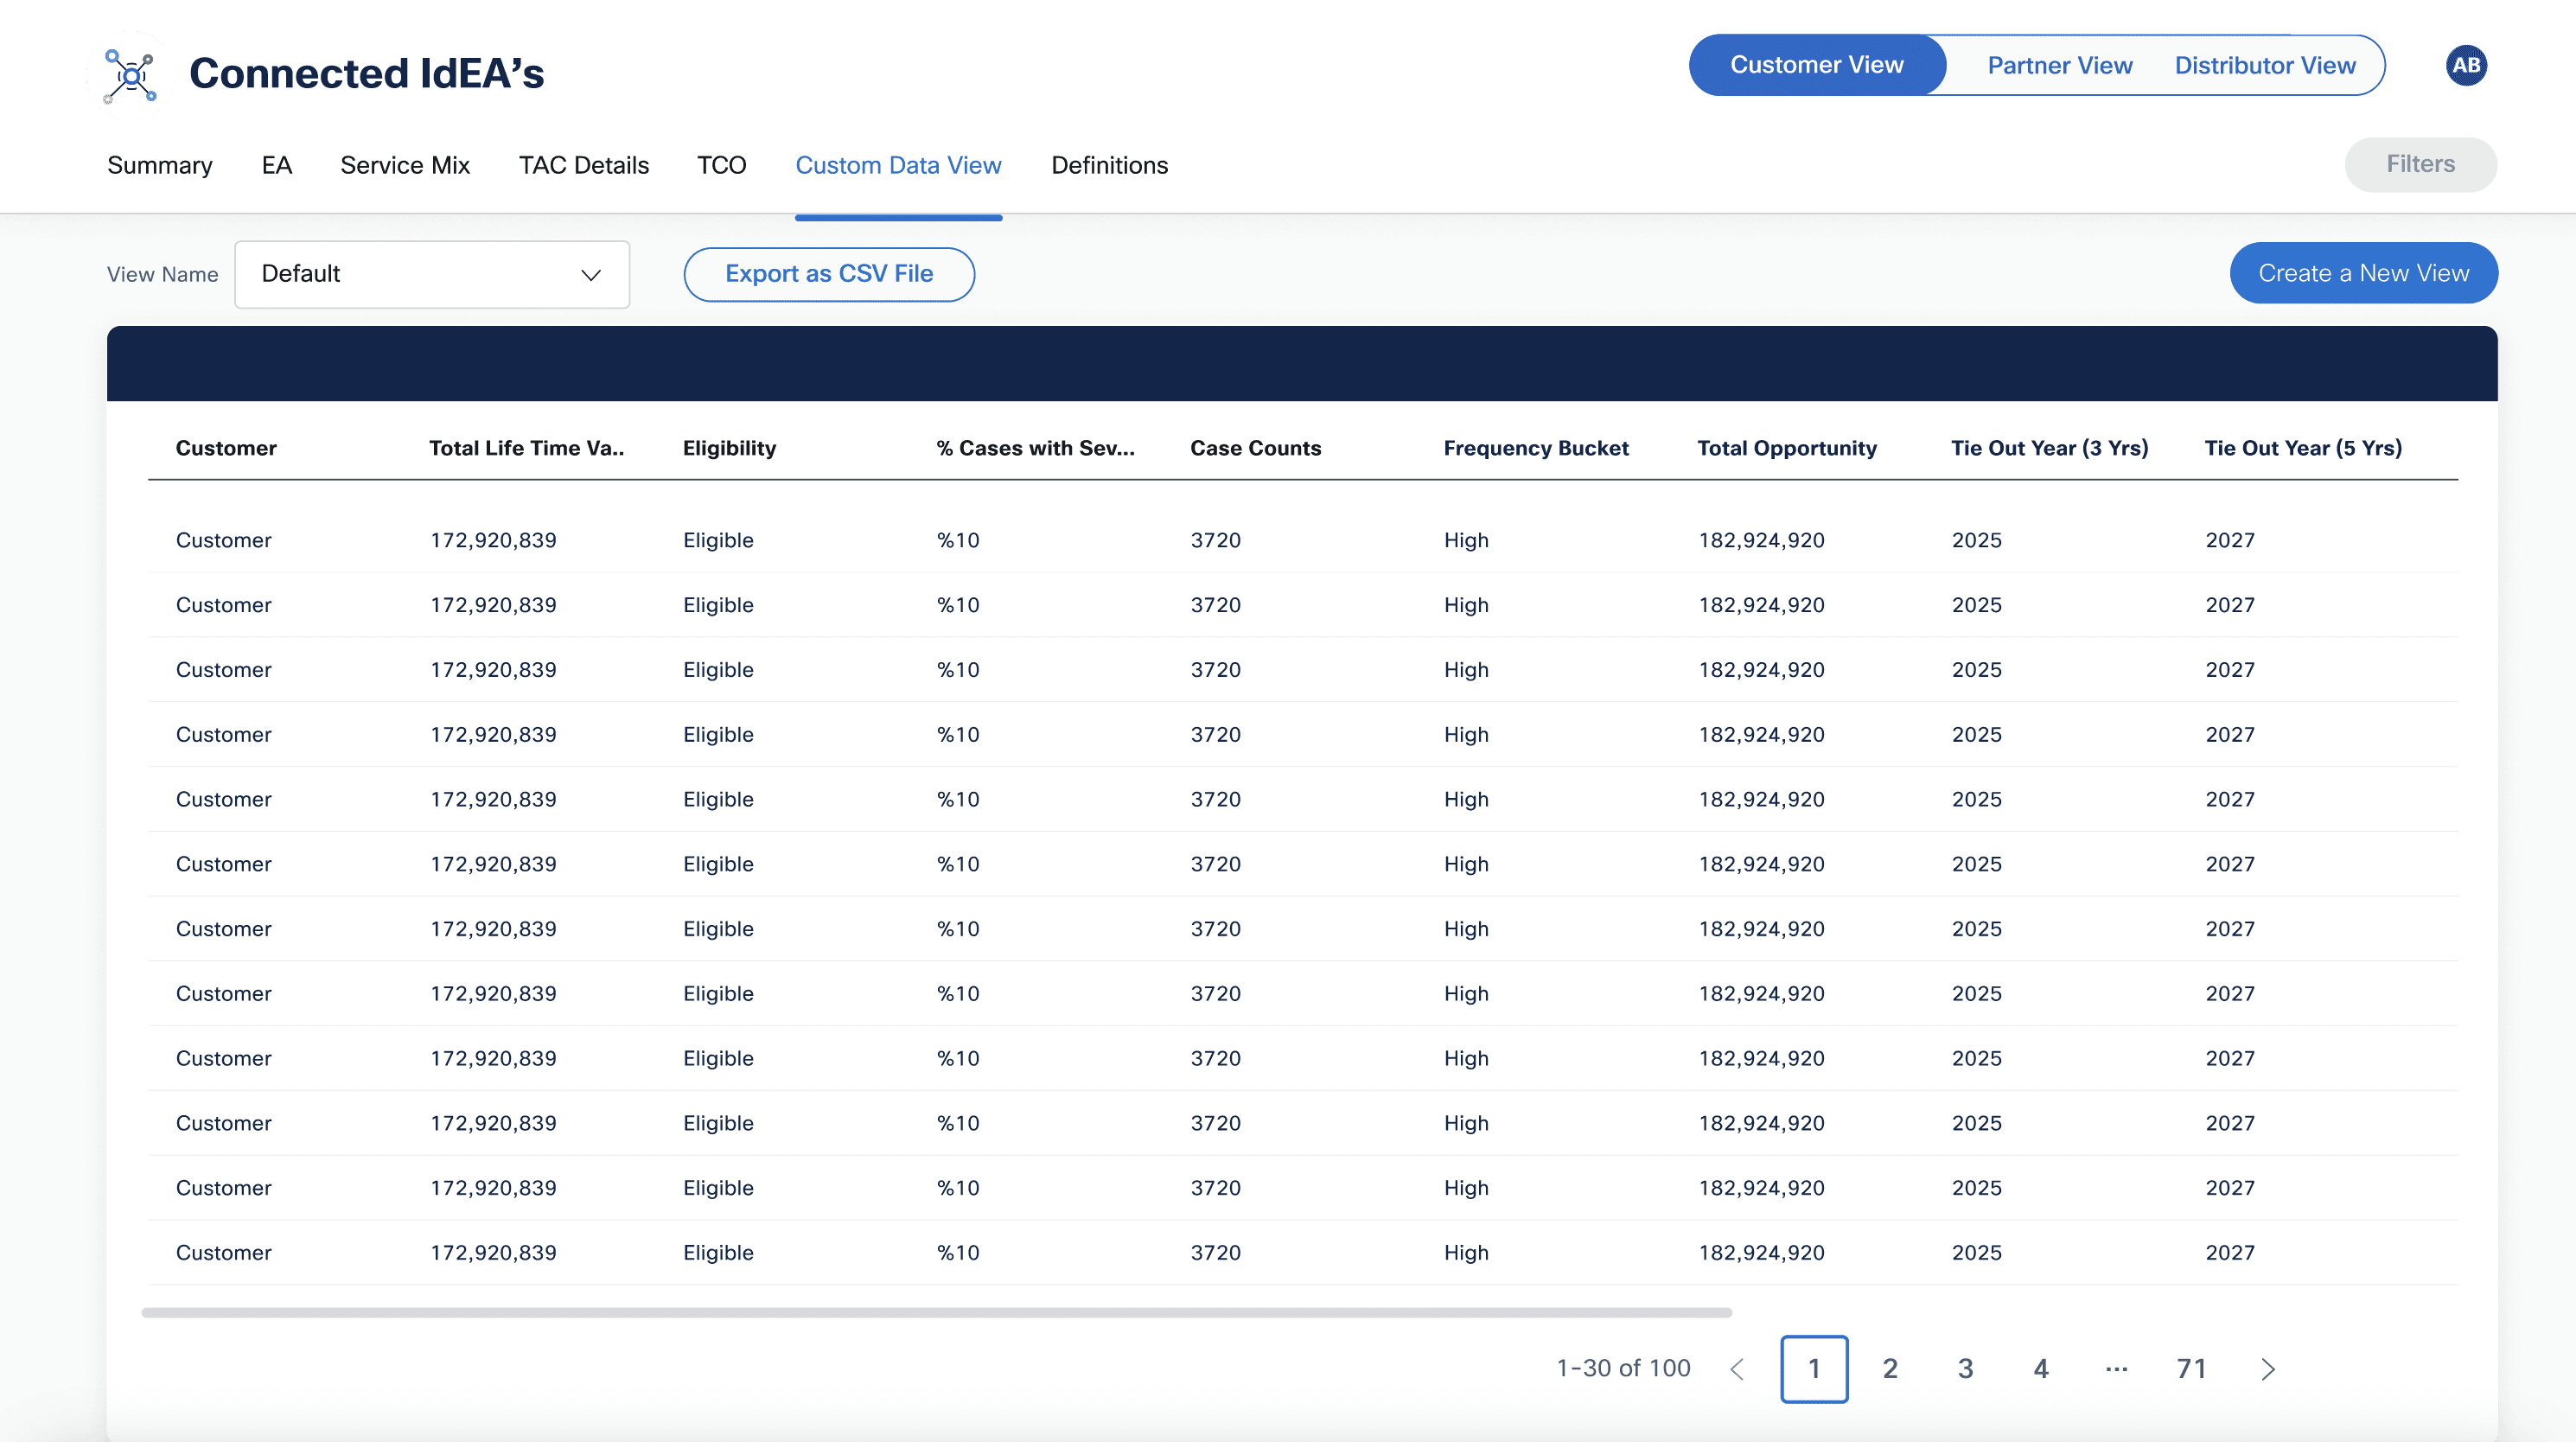
Allowing Customization of Data Tables and Generating Views
Allowing Customization of Data Tables and Generating Views
This flow enables sellers to create customized Data Views tailored to their specific use cases. Instead of navigating through multiple fields or attributes, users can select filters and attributes that align best with their needs to generate a view that is most relevant to them. Additionally, they have the option to save these views for future reference or download them as a CSV file for further analysis if required
This flow enables sellers to create customized Data Views tailored to their specific use cases. Instead of navigating through multiple fields or attributes, users can select filters and attributes that align best with their needs to generate a view that is most relevant to them. Additionally, they have the option to save these views for future reference or download them as a CSV file for further analysis if required
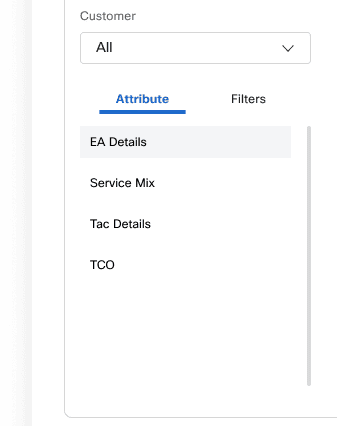
List of attributes was chunked into sections, so that the attributes are communicated in a manner that is easier to navigate for sellers and that also aligns with their mental model. They are placed on the left side of the page, providing a cue that they can first select all the attributes and filters on the left and then would be able to see all the selections on the right.
List of attributes was chunked into sections, so that the attributes are communicated in a manner that is easier to navigate for sellers and that also aligns with their mental model. They are placed on the left side of the page, providing a cue that they can first select all the attributes and filters on the left and then would be able to see all the selections on the right.
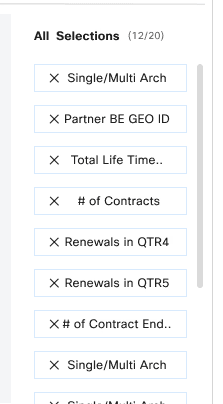
The selections panel provides sellers with a clear overview of all chosen attributes and filters, ensuring visibility into the system's status and keeping them informed about their actions. Additionally, a constraint limiting selections to 20 was introduced to minimize cognitive overload and encourage sellers to make thoughtful and focused selections.
The selections panel provides sellers with a clear overview of all chosen attributes and filters, ensuring visibility into the system's status and keeping them informed about their actions. Additionally, a constraint limiting selections to 20 was introduced to minimize cognitive overload and encourage sellers to make thoughtful and focused selections.
Impact
Impact
$160 Million
$160 Million
In Revenue for FY24 Global (APJC + AMER + EMEA)
In Revenue for FY24 Global (APJC + AMER + EMEA)
800+
800+
Number of Sales people that adopted connected ideas
Number of Sales people that adopted connected ideas
Connected Ideas was presented at Cisco GSX 2024 in Las Vegas